
Testing and debugging a project
Testing and debugging a project is often done hand in hand with developing that project. You will typically run, test, debug, and modify your project at design-time until it works properly. This section lists some tips to help testing and debugging, and also describes how to test event-driven actions. For information on the tools that Matrox Design Assistant offers to help you run your flowchart and access its results, see the Techniques for running the flowchart and accessing results section earlier in this chapter.
 Testing and
debugging tips
Testing and
debugging tips
The following is a brief list of tips and hints for testing and debugging your project:
-
Use the debug toolbar buttons.
To perform general testing actions, use the Debug toolbar buttons, accessible from the Project toolbar. For instance, to walk through your project a step at a time, and update the display and/or your results, use the Next step (
 ) toolbar button.
 -
Search with Edit Find.
To quickly locate expressions, steps and operator view elements, or variables in your project, use the Find pane, accessible from the Edit Find menu item.
-
Run only required steps.
-
Skip communication steps.
If a project is running on your runtime platform while you are debugging another project on your development computer, you are not able to use any of the platform's communication hardware. To skip all communication steps in your flowchart, select the Communications (
 ) toolbar button in the
Platform toolbar.
) toolbar button in the
Platform toolbar. -
Quick Run mode.
To quickly isolate and test small parts of large or complex projects (including legacy projects), use Quick Run mode. Only the selected step(s), and the steps it depends on are run.
-
Disable steps.
To make the flowchart skip one or more steps when it is run, select and then right-click on the step(s), and then select the Disable selected step(s) context menu item.
-
Select a step from the Step Log pane.
To select a step in your project, click on the step in either the flowchart (ensure that you have selected the Flowchart tab) or the Step Log pane. Note that the Step Log pane only lists the steps that have run.
-
-
Use the Quick Evaluate pane.
To display the current value of any step's input or output/result, as well as any expression, variable, or platform configuration setting, use the Quick Evaluate pane.
-
Choose images.
-
Use image sets.
If a project is running on your runtime platform while you are debugging another project on your development computer, you cannot access live grab images; therefore you must work with image sets.
-
Select the next image.
To view, exclude, or select the next image to be used at design-time, use the file thumbnails in the Camera Images pane.
-
Lock the image.
To stop your project from advancing through the sequence of images with which you are testing, lock the image in the Camera Images pane. This allows you to perform further validation on the configuration of your steps against particularly troublesome images.
-
Select image to display.
For steps that do not normally have an image, you can select one from the View Display Image menu item.
-
-
Use a trace file.
To analyze your project's execution, for debugging or optimization, you can generate a trace file using Matrox Profiler.
For information about testing your project's operator view at design-time, see the Testing and debugging operator views at design-time section in Chapter 50: Customizing the operator view.
Testing
event-driven actions
As previously discussed in Events and actions, there are several kinds of event-driven actions (operator view publishing, PLC handshake, and subflowchart execution). While testing your project at design-time, it can be helpful to view or execute these actions in that project.
Viewing action
lists
To view the actions that happen when the flowchart reaches an action point, click on the action point, such as inspection start or inspection end.
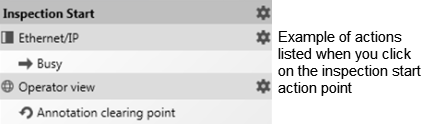
The number of actions listed depend on whether you have enabled Quick Comm, which automatically configures a handshake with the PLC, and whether you have created any Auto DataToPLC fields.
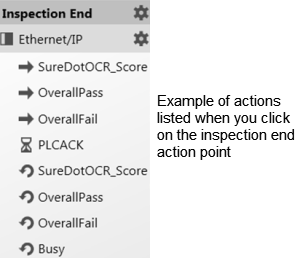
Clicking on any of the gear symbols, at the top-right of the listed actions, takes you to an advanced settings dialog (where you can make modifications to the corresponding action).
Viewing
currently executing actions or pending actions
While viewing a subflowchart that is set to run upon an event, the bottom of the flowchart pane displays an orange dot to indicate that the subflowchart is currently executing due to an event-trigger. The flag indicates that a call to the corresponding flowchart is pending.
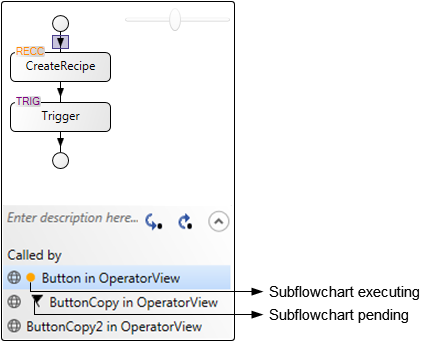
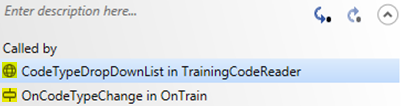
The circular symbol (as shown below) indicates that the event that triggers the subflowchart action is called from the operator view, while the rectangular symbol (as shown below) indicates that it can also be called from a subflowchart step.
When accessing the Operator View Layout tab, you can simulate a button click from the Interface Actions pane. After doing so, a flag in the Platform toolbar (the Events pending toolbar button) can appear with a number, to indicate how many subflowcharts are pending.
Simulating a button click lets you mimic a user clicking the button that executes the subflowchart from the operator view.
Forcing
the execution of a subflowchart that runs upon an event
To test (debug) a subflowchart that is typically called by an event-trigger at runtime, access the subflowchart and click the Step In button. After testing the subflowchart, click on the Step Out button, otherwise you can experience difficulties with other parts of the project at design-time.

Viewing the subflowcharts listed under Called by and using the Step In and Step Out buttons can be considered ways to navigate your subflowcharts.
Note that projects can also have subflowcharts that are not called by an event-trigger. These subflowcharts are executed, like other steps, when testing the project at design-time.