
Profiling and troubleshooting logs
 Previous
- Next

To analyze your project's execution, for debugging or optimization, you can generate a trace file, which contains information such as when each step starts and stops, and when and how long it takes to publish to the operator view. Matrox Profiler is a tool that creates and graphically displays these trace files.
 Generating a new
trace file
Generating a new
trace file
Matrox Profiler can generate a trace file only for deployed runtime projects. Consequently, the Matrox Profiler must be running on the runtime platform. The basic procedure for generating a trace file is platform independent: start a trace, start a runtime project, terminate the runtime project, stop the trace, read the trace using Matrox Profiler. The specific procedures are slightly different depending on whether the runtime platform is a supported Matrox smart camera or a PC.
Procedure
for generating a trace file on a PC runtime platform
Procedure
for generating a trace file on a Matrox smart camera
Reading a trace
file
Once the trace file has been generated, and both the runtime project and the trace generation have been terminated, you can read the trace file using Matrox Profiler. The file has a .trace extension. To read the trace file generated:
-
Open the MIL Control Center, found in C:\Program Files\Matrox Imaging, on your development computer.
-
Open Matrox Profiler, accessible from the General Tools section of the MIL Control Center.
-
Select the File Open menu item in Matrox Profiler and navigate to the location of the trace file on the runtime platform.
When connected to a PC platform, the trace files are saved in the C:\Users\USERNAME\AppData\Local\Temp\Profiler folder, by default.
-
Select the most recent file, if there is more than one.
Once a trace file has been opened, it can be examined with Matrox Profiler. Matrox Profiler will graphically display project execution information, such as step duration, as a time line. While a trace file can display multiple threads, represented as stacks of rows in the example below, the top thread will contain all the step information, which includes most operator view and communication information as well. A trace file visually represents a loop, step, or other element, as a block. Blocks can contain other blocks, as a loop block will contain all its step's blocks.
The top row is divided into loop blocks. Each loop contains steps and operator view updates, in the order they are executed. The lower rows contain additional information, such as mouse interactions on the operator view.
The following image displays a trace file with 4 threads. 2 threads have been closed in this view. You can toggle the display of each thread using the arrow next to the thread's name.
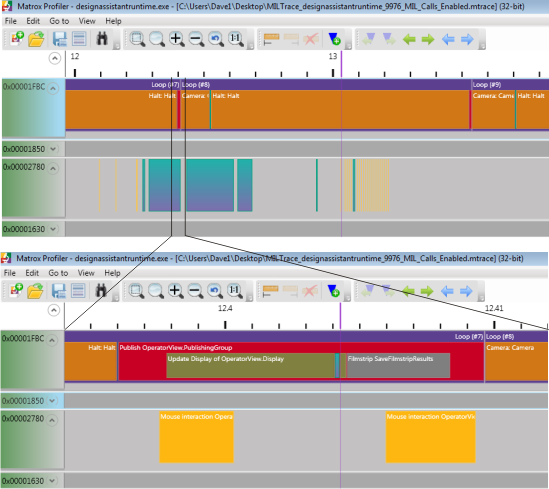
The time frame of the trace file is found above the top thread and is measured in seconds. You can zoom in or out, expanding or contracting the time frame, by using the zoom buttons in the toolbar, or by scrolling with your mouse wheel. There could be many steps or interactions that appear as a single block when viewed with one time frame, and become apparent only when zooming in or out of an area. The above image displays the same trace file in 2 time frames. Note the time displayed above the threads has a different number of decimal places.
You can get detailed information about the entire trace, or any specific element selected, by clicking Statistics on the far right of the window. Select the Statistics source dropdown menu to specify to view either information for the entire trace or just a single selected element. Note that you must click on the Refresh button for each change. To view the Statistics option, click on the View Quick Access menu item.