Techniques for running the flowchart and accessing results
Developing a project typically involves running the flowchart at design-time from your development computer, viewing results, and modifying settings. This process is repeated until the flowchart produces the results you expect. The following subsections list some of the techniques you can use to help with this process. Each subsection links to the User Interface Reference, where you can get more information. Techniques are listed according to how often they are typically used. These techniques can also help testing. For more information on tips to help testing and debugging, see the Testing and debugging a project section later in this chapter.
 Debug buttons
In the Project toolbar, there are several toolbar buttons that let you perform general debugging actions, such as running the project to a selected step. These buttons are also available from the Debug menu.
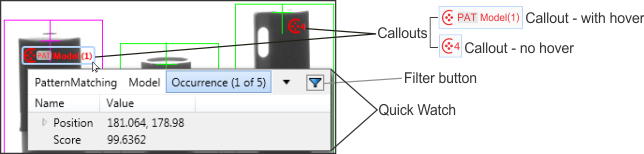
Quick Watch flyout
panel and callout annotations
The
Quick Watch flyout panel and callout annotations let you
easily access key results from the selected step's displayed image.
To open the
Quick Watch flyout panel, click on a callout annotation,
which is a small graphic that is typically visible for each result
of the selected step's displayed image. Hovering on a callout
reveals more information. You can drag and drop results from the
Quick Watch flyout panel into other parts of your project
(for example, into the
Quick Evaluate pane or the input of another step). To
manage how callouts are displayed (visibility), click the
Annotations ( )
toolbar button in the
Project toolbar.
)
toolbar button in the
Project toolbar.
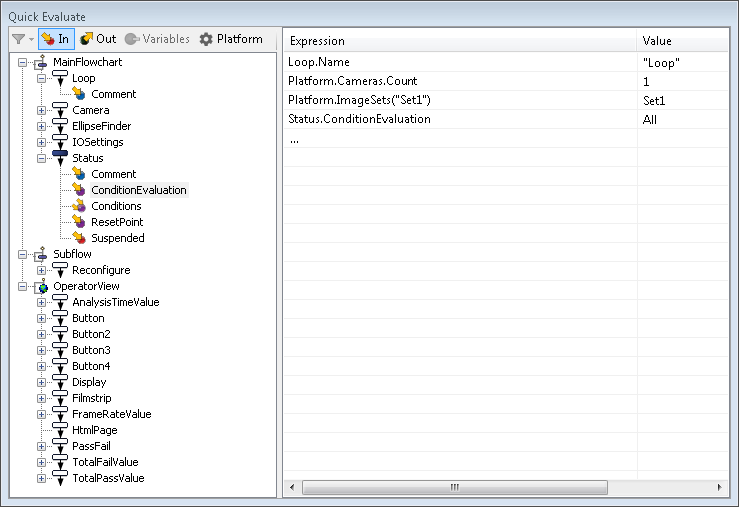
Quick Evaluate
pane
The Quick Evaluate pane lets you navigate to, and display the current value of any step's input or output/result, as well as any variable or platform configuration setting, while a project is running. It also allows you to evaluate images, by viewing one or more simultaneously. You can use this pane to add, modify, drag and drop, and copy and paste expressions.
Camera Images
pane
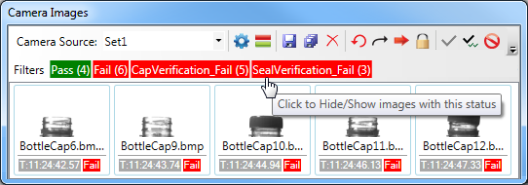
The Camera Images pane manages and displays which images each Camera step uses (including image sets). The top-left of this pane has a Filters option that lets you select the images to display, based on whether they have a pass or fail status.
Find pane
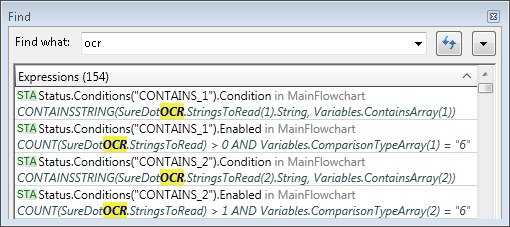
The Find pane, accessible from the Edit Find menu item (or Ctrl+F), lets you search a project for the specified search query.
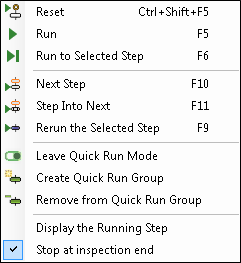
Quick Run mode
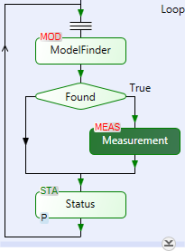
When you are in
Quick Run mode, only the selected step, and the steps it
depends on, are run. when clicking the
Run to selected step (![]() ) toolbar button does not reach the step you want. To
use Quick Run, right-click on the step to test and choose the
Create Quick Run Group context menu item. You are now in
Quick Run mode and the flowchart is analyzed to determine all the
steps upon which the selected step, also known as the root step,
depends. The root step, and the steps it depends on, will be in
green. All other steps are hidden with a collapse symbol.
) toolbar button does not reach the step you want. To
use Quick Run, right-click on the step to test and choose the
Create Quick Run Group context menu item. You are now in
Quick Run mode and the flowchart is analyzed to determine all the
steps upon which the selected step, also known as the root step,
depends. The root step, and the steps it depends on, will be in
green. All other steps are hidden with a collapse symbol.
Step Log pane
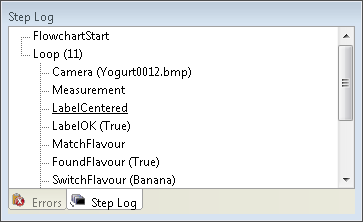
The Step Log pane displays information about the execution of your steps, such as the step on which your project stopped, as well as the number of times each loop in your project was performed.
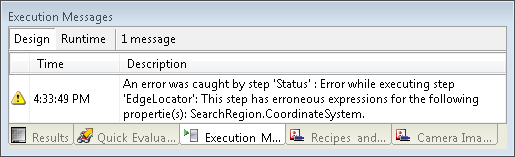
Execution
Messages pane
The Execution Messages pane displays all the messages generated during design-time or runtime (as specified with the tabs at the top of the pane).
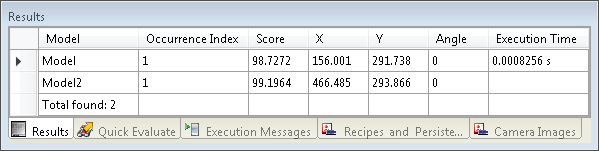
Results pane
The Results pane lets you access results. Results are also easily accessible from the Quick Watch flyout panel (this is the recommended way to access results).