Procedure for using a depth map
Matrox Design Assistant automatically remaps depth maps. When another step links to the Camera step, the depth map's bit depth is contracted or expanded to meet the new step's requirements. You can disable this feature.
Once you have acquired a depth map, you can select a Z-range from the total depth of your image. Your selection is displayed using a full span of values, allowing for easier distinction of depth and details. You can also specify gap filling settings, which determine how to handle invalid depth map pixels. In addition, you can specify display settings for your depth map.
The following procedure provides a basic methodology for using the Camera step to configure depth map settings:
-
Verify Remapping settings.
-
Optionally, specify a Z-range to target specific depths of the depth map, if you don't want to work with the full range.
-
Specify gap filling settings.
 Remapping
Setting the
Z-range
You can select a Z-range from the total depth of your image and specify how to deal with pixels outside of this range.
-
Select the Z-range. In the DEPTH MAP REMAP tab, manually adjust the sliders, or choose a Start Mode and/or End Mode from the dropdown list:
-
MinValue or MaxValue. Choose the minimum or maximum depth as an end point of the Z-range. Choose both MinValue and MaxValue to specify a Z-range that includes all depths in the depth map.
-
Custom. Adjust the sliders or enter a specific Start Value or End Value. Note that this mode is automatically selected if you use the sliders.
-
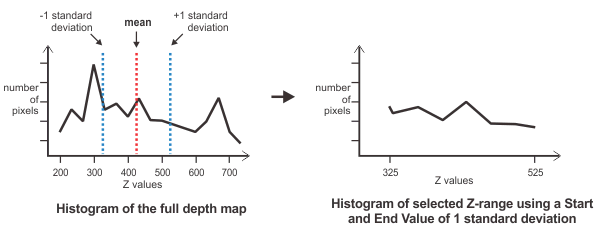
StdDev. Enter a value equivalent to the number of standard deviations from the mean depth, for which you want to start or end the Z-range. The default value is 1, which sets the start or end at 1 standard deviation below or above the mean depth value.
The following illustration shows an example StdDev selection.
Note that when the depth map is remapped, the scale along Z is adjusted so that each pixel maintains its real-world depth value in Z.
-
-
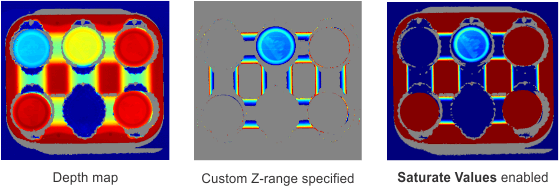
Enable or disable the Saturate Values checkbox. When enabled, depth values smaller than the specified Z-range minimum are set to that minimum. Similarly, depth values larger than the specified Z-range maximum are set to that maximum. Otherwise, pixels with a depth outside the selected Z-range are considered invalid.
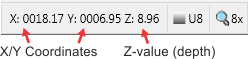
You can see a pixel's Z-value in the display status bar, located below the depth map display. The bar shows the Z-value, as well as the X- and Y-coordinates, of the pixel under the mouse cursor, and updates as the cursor moves. For a calibrated depth map, the X- and Y-coordinates are in calibrated units; to show them in pixel units, right-click on the image to display the context menu and uncheck Calibrated Coordinates. When you do so, the Z-value switches to show intensity (gray) values.
Filling gaps
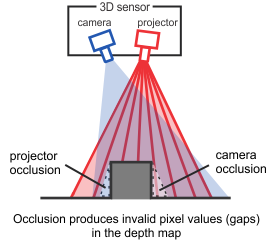
Gaps, or invalid values, are missing data points in the depth map, where the 3D sensor could not pick up information, due to occlusion, reflections, or areas out of the camera's field of view.
Typically, 3D sensors set invalid pixels to the maximum or some other distinct value, depending on the sensor's specifications. Alternatively, some 3D sensors identify invalid pixels using a separate mask or map, such as a confidence map.
In Matrox Design Assistant, you can fill gaps. For some applications, you can reasonably approximate gap values with an interpolation of neighboring depth values. In other situations, such as when the gap spans an abrupt change in depth, or the gap is very wide, you can replace the invalid value with a constant value, such as the minimum/maximum depth value, or you can choose to propagate one of the gap's boundary values across the gap.
Gaps are filled in a 2-step process: first along X, then along Y (or vice-versa). For example, if you choose to fill first along the X-direction, all gaps along rows in the depth map are evaluated and filled before any columns are examined (see below for evaluation criteria). Therefore, gaps are examined not as an X-by-Y area to be filled, but on a per-row (or column) basis.
Note that gaps whose boundaries touch the border of the image are not filled. That is, a gap qualifies for potential filling only if it exists between 2 non-invalid pixels. You can, however, replace the pixel values of gaps that touch the border with the Replace Remaining Invalid Values setting (also discussed below).
Note that gap filling is only supported for 32-bit depth maps if depth map remapping is enabled (default). See the Remapping subsection of this section.
To fill gaps, perform the following:
-
Choose the DEPTH MAP FILL GAP tab in the Camera step's Configuration pane.
-
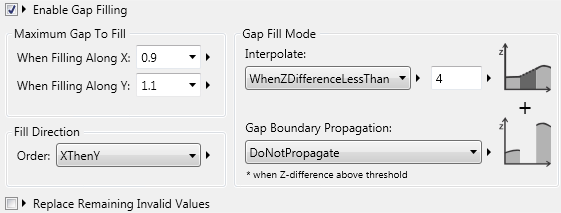
Enable the Enable Gap Filling checkbox.
-
Set the size of the Maximum Gap To Fill. Enter a maximum gap size for the When Filling Along X and When Filling Along Y inputs, where Infinite specifies no maximum size. If your depth map is calibrated in X and Y, use calibrated units for these inputs.
-
Set the Fill Mode, which determines gap replacement pixel values. Set Interpolate to one of the following:
-
Always. Specifies to fill all gaps with a linear interpolation between the 2 depth values on either side of a gap. (This difference in depth is known as the Z-difference).
-
WhenZDifferenceLessThan. Specifies to interpolate only when a gap's Z-difference is below the specified threshold. Enter a threshold below which a gap's pixels are filled with interpolated values. If a gap's Z-difference is above this threshold, gaps are filled according to the Gap Boundary Propagation setting. Possible settings are:
-
GapMinZ. Specifies to propagate the minimum gap boundary value across the gap.
-
GapMaxZ. Specifies to propagate the maximum gap boundary value across the gap.
-
DoNotPropagate. Specifies not to fill gaps.
-
-
Never. Specifies not to interpolate. Gaps are filled according to the Gap Boundary Propagation setting, as described above.
The illustration below shows how gaps are filled when Fill Mode is set to the following:
Interpolate = WhenZDifferenceLessThan.
Z-difference threshold value = 20.
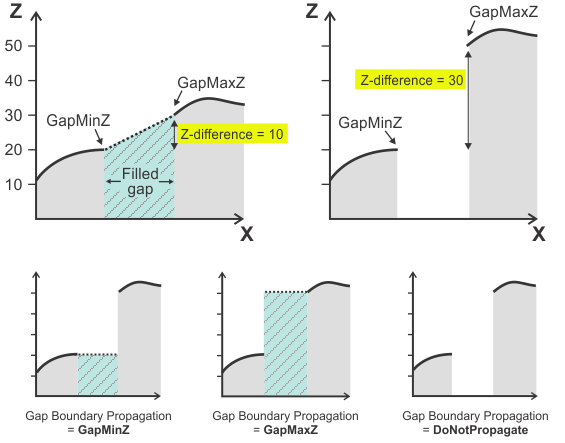
Above left, the gap's Z-difference is less than the threshold of 20; therefore, interpolation is applied.
Above right, the gap's Z-difference is greater than 20; therefore, filling depends on the Gap Boundary Propagation setting, as illustrated in the 3 subsequent graphs.
-
-
Set the Fill Direction. Specify the Order in which to fill the missing data points: along rows first, then columns (XthenY), or vice versa (YthenX).
-
Optionally, enable the Replace Remaining Invalid Values checkbox to control all gaps, including gaps touching the image border and leftover gaps not filled under Enable Gap Filling. Set the Fill Value input to one of the following:
-
MinValue. Sets remaining values to the minimum depth value of the selected Z-range.
-
MaxValue. Sets remaining values to the maximum depth value of the selected Z-range.
-
Enter a specific value between the minimum and maximum depth of the depth map.
-
The following images show the same depth map with various gap filling settings.
|
Depth map |
Settings |
Notes |

|
No fill settings enabled. |
Unfilled gaps are displayed in white (MILPseudo colormap). |

|
|
All non-border gaps are filled with interpolated pixel values. In this case, and in the subsequent images, the following settings also apply:
|

|
|
Only gaps with a Z-difference less than 8 are filled with interpolated pixels. Remaining gaps are left untouched. |

|
|
Gaps with a Z-difference less than 8 are filled with interpolated pixels. Gaps with a Z-difference above 8 are filled with the minimum gap boundary value (GapMinZ). |

|
|
When you enable Replace Remaining Invalid Values, any previously unfilled gaps are filled with the specified Fill Value. Note that this includes unfilled gaps that were specified with DoNotPropagate under Enable Gap Filling. |

|
|
All invalid pixels or gaps are replaced with the specified Fill Value. |
Display options
You can display depth maps with one of several colormaps. By default, Matrox Design Assistant displays depth maps with the Jet colormap. To change the colormap, right-click on the display, and when the context menu appears, select Colormap and then the required colormap. You can also change the colormap from the Display element of the operator view layout. For more information on colormaps, see the Displaying images using a colormap section in the Display view reference chapter.
Note that, when you choose a depth map tab in the Camera step's Configuration pane, the display changes to depth map. When you choose the IMAGE REMAP tab, the display changes to the intensity image. Depth maps and intensity images have independent colormap settings.
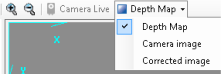
You can right-click on the image to change the displayed image from the Display Image option, or you can click on the Camera step image toolbar button in the Project toolbar to choose which image to display from a dropdown list..
A depth map is often one component of several from a 3D sensor. For example, in addition to a depth map, you might have an intensity image and a confidence map. You can choose to display more than one image at a time, including the same component at different available bit depths. For information on displaying multiple images at once, see the Displaying multiple images subsection of the Quick Evaluate pane section in the Panes and editors reference chapter.
Line profiles and
histograms for depth maps
You can draw a line profile across a depth map. The resulting Line Profile graph shows depth values for the region underneath the drawn line.
To draw a line profile, click on the
Trace a line profile ( )
toolbar button in the
Project toolbar, and then click on the display to draw a
line. The accompanying
Line Profile graph shows the depth at each pixel along the
line. The X-axis represents the distance along the line in
calibrated units and the Y-axis represents the depth. (For an
uncalibrated depth map, the X-axis represents pixel units.) When a
line profile crosses a region of invalid points, the line on the
graph displays in red, indicating approximated depth values.
)
toolbar button in the
Project toolbar, and then click on the display to draw a
line. The accompanying
Line Profile graph shows the depth at each pixel along the
line. The X-axis represents the distance along the line in
calibrated units and the Y-axis represents the depth. (For an
uncalibrated depth map, the X-axis represents pixel units.) When a
line profile crosses a region of invalid points, the line on the
graph displays in red, indicating approximated depth values.
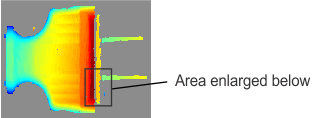
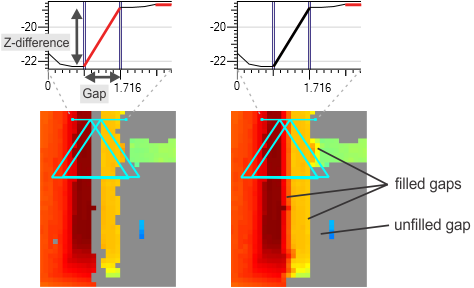
From a Line Profile graph, you can determine the exact width of specific gaps, or find the Z-difference of a gap; you can use these values to establish gap filling settings. Typically, values just above the exact measurements give successful results. For example, using the line profile below, the targeted gap's width is 0.85 units, so the Maximum Gap To Fill inputs are set to 0.9 units along X and 1.1 units along Y. The measured Z-difference is about 3.2 units, so the Z-difference threshold is set to 4.
Note the unfilled gap (labeled below). Given the gap filling settings used in this example, the gap remains unfilled because its width (2.8 units) is larger than the maximum gap and its Z-difference (4.8 units) is larger than the specified Z-difference threshold.
For more information on line profiles, see the Line Profile graph subsection of the Using the display graphs section in the Display view reference chapter.
A
Histogram graph shows the number of pixels with a specific
depth in a region of the depth map. To see the graph, click on the
View histogram ( )
toolbar button. The graph's X-axis represents depth values and the
Y-axis represents the number of pixels in the image that have that
depth.
)
toolbar button. The graph's X-axis represents depth values and the
Y-axis represents the number of pixels in the image that have that
depth.
You can place graph markers along the histogram to target specific depths. The accompanying table below the graph shows related pixel information, including the Count of pixels at each graph marker. Also available below the histogram is a table with statistical information about the entire region, such as the mean depth value.
For more information on histograms, including how to specify a region from which to create the Histogram graph, see the Histogram graph subsection of the Using the display graphs section in the Display view reference chapter.
Processing and analysis of
depth maps
Saving
To save a depth map and its related image components, right-click on the display view, and choose Save image as... from the context menu. Choose the 3D components option and specify a location. Note that, to save annotations with a depth map or another image component, you must choose Displayed image and enable the Include annotations option, which saves a single image with its annotations.
Alternatively, you can save from the
Camera Images Pane toolbar, using
Save selected images (![]() ), or the
Save all images (
), or the
Save all images (![]() ) toolbar button. In this case, all 3D components are
saved.
) toolbar button. In this case, all 3D components are
saved.
You can use the ImageWriter step to save depth maps at runtime. See the Procedure for using the ImageWriter step section in Chapter 33: ImageWriter step for more information.