Display features during design-time
There are several display-related features that you can use to help develop your project, such as graphs that show you image statistics and annotations that help you manage results.
By default, when you access the Flowchart tab in the user interface, you see both the flowchart and the selected step's displayed image. To change this (for example, to see only the flowchart), use the View menu item.
 Zooming
You can zoom the flowchart using the
sliding zoom bar, which fades in more clearly as you hover over
the top-right of the flowchart. To zoom the selected step's
displayed image, use the mouse wheel or click the
Zoom In ( ) or
Zoom Out (
) or
Zoom Out ( )
toolbar buttons in the
Project toolbar.
)
toolbar buttons in the
Project toolbar.
Display status
bar
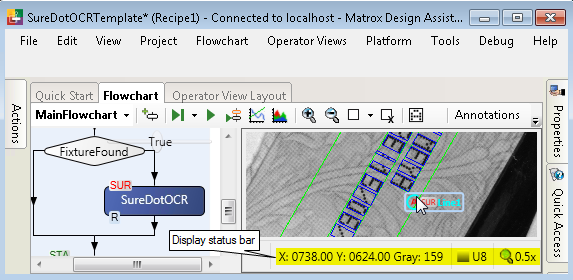
The display status bar, located below the selected step's displayed image, shows the X- and Y-coordinates (and Z-coordinates in the case of depth maps), as well as the gray intensity or color value, at the position of your mouse cursor as it passes over the image (the zoom factor is also shown). The coordinates are in calibrated world units if the step's image is associated with a calibration; to show them in pixel units, right-click on the image and uncheck the Calibrated Coordinates context menu item.
Annotations
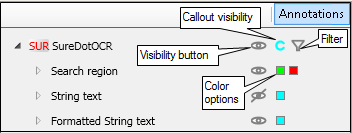
You can modify if annotations are hidden, or how they are displayed, using the Annotations control panel. This is opened by clicking on the Annotations toolbar button in the Project toolbar. The Annotations control panel provides a list of all the annotations in the project, grouped according to the steps to which they belong. You can choose which annotations appear in the list using the Filter button, specify the annotations to display on the image using the Visibility button, modify the visibility of callout annotations using the Callout visibility button, and select the colors in which to display annotations from the available Color options.
For more information on using the Annotations control panel, refer to the Annotations section in the Display view reference chapter.
Displaying a
step's images
Display graphs
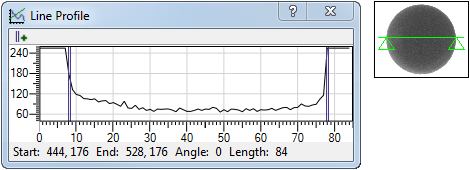
There are 3 graphs that convey pixel data about the selected step's displayed image: the Line Profile graph, the Histogram graph, and the Edge Values graph.
In the Project toolbar, you can access these graphs by clicking on their respective toolbar buttons . The graphs are for design-time and do not directly impact the project. They are intended to provide useful information for setting up the project. For example, you can use the Line Profile graph to draw a line across a dot that makes up a dot-matrix character. This lets you determine where the pixel intensity shifts, from bright to dark and from dark to bright. You can use the distance between these major intensity shifts to establish the dot diameter to use for performing character recognition with the SureDotOCR step.