
Selecting and running a step
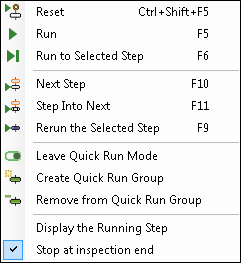
You can use the Debug menu items, or the
Debug toolbar buttons, to run, run to step, or pause the
running flowchart at design-time. For example, to run to a step,
select it and then click on the
Run to selected step (![]() ) toolbar button in the Project
toolbar.
) toolbar button in the Project
toolbar.
 Current or
last step executed
Current or
last step executed
Selected step
Display updates
Stopping at
inspection end
When you run to a selected step, the flowchart typically stops executing at that step. However, if that step's execution is based on some prior condition, and that condition fails, the selected step will be skipped. In this case, the Debug Stop at inspection end menu item specifies whether the flowchart should stop running at the Inspection End action point, or whether it should loop back to the beginning and continue running to the selected step.
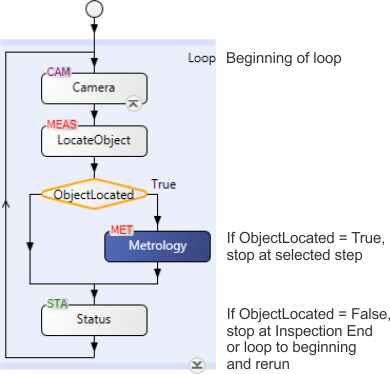
The Debug Stop at inspection end menu item is enabled by default, ensuring that the flowchart stops at its Inspection end action point, even if the selected step is not run. This allows for the inspection of all step results for the current image.
If you disable the Debug Stop at inspection end menu item, the flowchart loops back to the beginning, and will execute on another image. This can cause confusion regarding why the flowchart is not stopping at the selected step. For more information on the Debug menu items, as well as other tools to run your flowchart and access its results, see the Techniques for running the flowchart and accessing results section in Chapter 2: Building a project.
For more information on tips to help testing and debugging, see the Testing and debugging a project section in Chapter 2: Building a project.
Wait notification
bar
While running a project at design-time, if a step takes too long to execute (typically over 1 second), the Wait notification bar appears at the bottom of the flowchart.
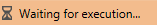
This can occur, for example, while waiting for a trigger or a handshake. The Wait notification bar can also appear while executing an Analysis and Processing step. For more information, see the Interacting with the Wait notification bar section later in this chapter.